Real-Time Observability.
Actionable Insights.
Business Impact.
We deploy and operationalize enterprise observability platforms powered by ClickHouse — the world's fastest real-time analytics database. We don't just install tools; we architect the full stack: ingestion, enrichment, analytics, alerting, and business-facing dashboards, end to end.
From financial-services loan-lifecycle monitoring to connected-vehicle telemetry and live market microstructure, our deployments become the operational backbone for organizations that can't afford blind spots.
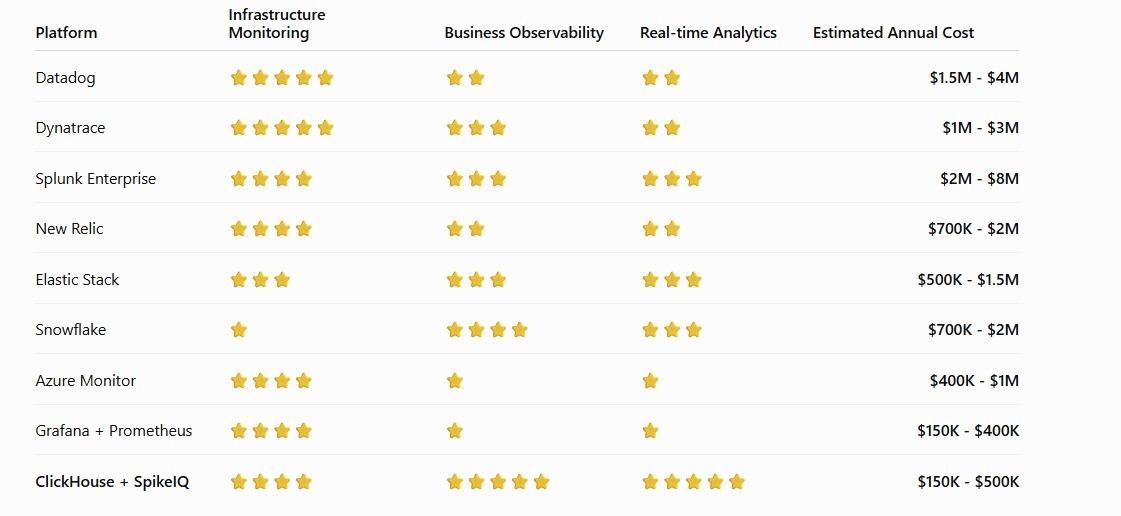
The economics of seeing everything.
Traditional observability stacks force a brutal trade-off: either you capture everything and pay seven figures, or you sample and accept blind spots. ClickHouse breaks the trade-off — full-fidelity ingest, sub-second analytics, and high-cardinality business observability at a fraction of legacy cost.
We pair ClickHouse with a real-time reduction layer so millions of raw events become a handful of meaningful, actionable signals — the difference between data you store and insight you act on.
A single backbone for the
entire loan business.
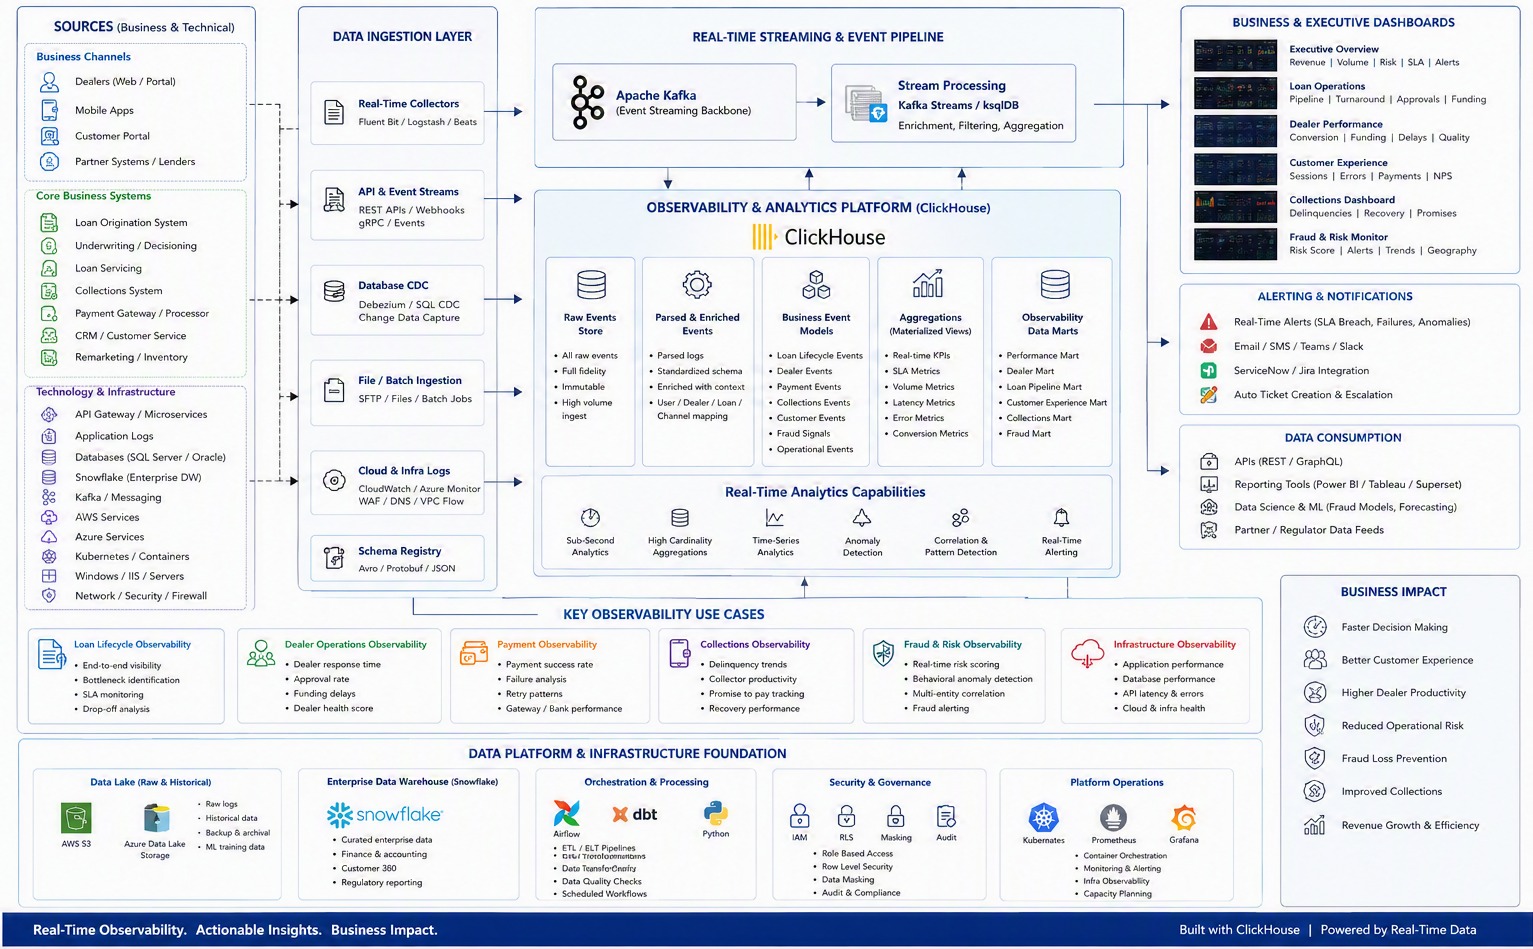
A real-time observability and analytics platform for a major financial-services client — spanning loan lifecycle, dealer operations, payments, collections, fraud, and infrastructure on one ClickHouse-powered backbone.
Real-Time Observability Platform — Financial Services
ingestion → kafka streaming → clickhouse analytics → executive dashboards
From the factory floor to the
vehicle, in real time.
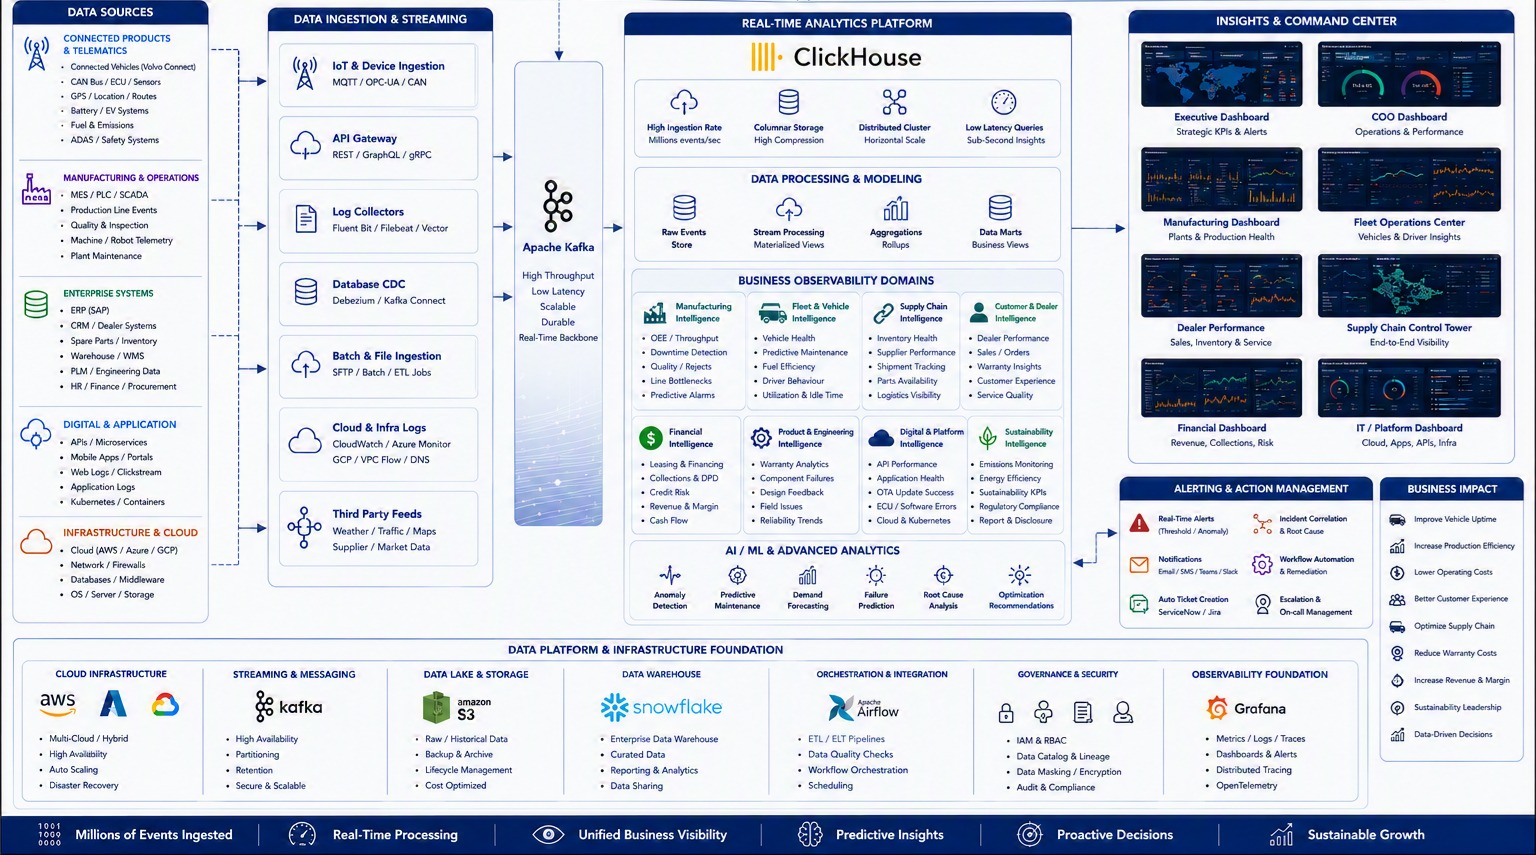
A business-observability platform unifying manufacturing, fleet & vehicle telemetry, supply chain, and customer signals — turning millions of IoT and operational events into command-center clarity.
Connected Industry Observability — Manufacturing & Mobility
iot & cdc → kafka → clickhouse domains → insights & command center
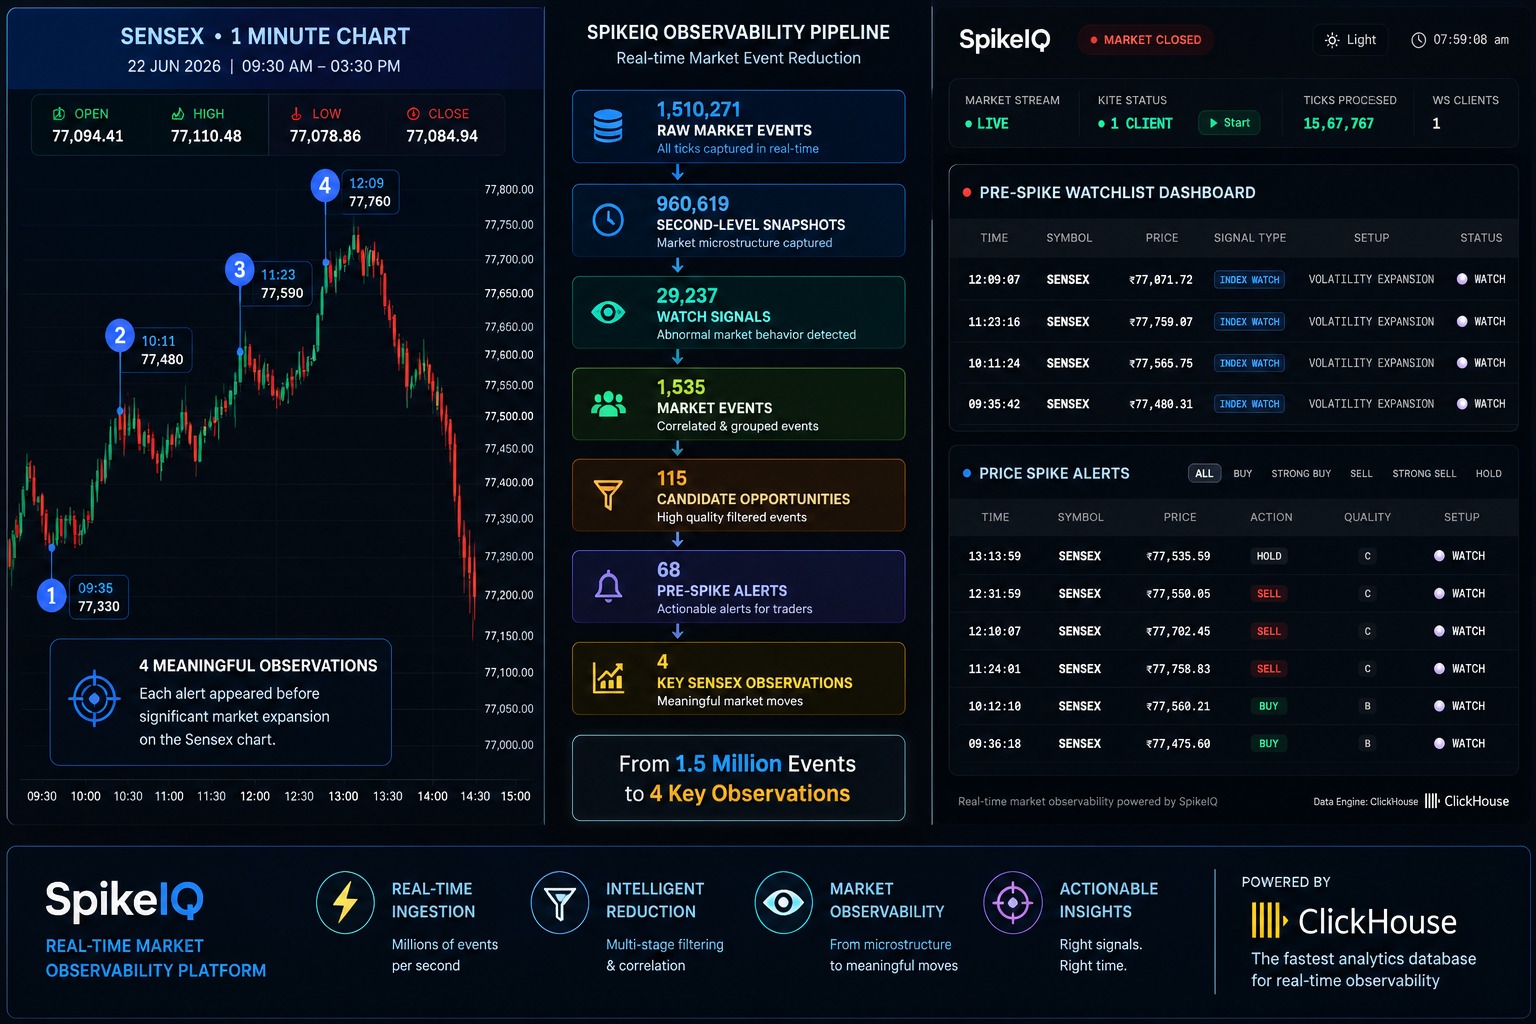
From 1.5 million events
to 4 decisions.
Market Observability, powered by ClickHouse
SpikeIQ is a real-time market observability pipeline: it ingests millions of live ticks, captures market microstructure, and reduces the noise — through multi-stage filtering and correlation — down to a handful of pre-spike, actionable observations.
It is the same engineering pattern we apply across every observability engagement: full-fidelity capture, intelligent reduction, meaningful signal — right signal, right time.
What we build. What it delivers.
Data Ingestion Layer
Real-time collectors (Fluent Bit / Vector), API & event streams, database CDC via Debezium, batch file ingest, and cloud infra logs — unified into one streaming backbone.
Kafka Streaming
Apache Kafka as the event backbone with ksqlDB stream processing — enrichment, filtering, and aggregation in real time before data lands in ClickHouse.
ClickHouse Core
Raw event store, parsed & enriched events, business event models, materialized aggregations, and domain data marts — structured for sub-second queries at petabyte scale.
Executive Dashboards
Revenue, volume, risk, and SLA views. Operations, performance, customer experience, and risk monitoring — real-time and role-appropriate.
Alerting & Auto-Escalation
Real-time SLA, failure, and anomaly alerts via Email, SMS, Teams, Slack. ServiceNow / Jira integration with automatic ticketing and escalation.
Security & Governance
IAM, row-level security, data masking, and audit trails — regulatory compliance without sacrificing real-time performance.